

The Data Concepts
The Data Concepts


Topics Covered: Data, Data Vs Information, DIKW Pyramid, Different Aspects of Data (Formats, Scope, Biases), Structured, Semi-structured and Unstructured Data, Data Usage (Scientific Research, Business Management, Finance, Governance), Data Analysis
DATA
Data is the backbone of data-driven AI. So let’s first understand what is data.
Data is the raw fact without any context i.e. a number, symbol, character, word, codes, graphs, etc.

Data has originated as a plural form of Latin word ‘Datum’, which means ‘a given fact’.
Broadly speaking, it can be any information in digital form, it can be the output of a sensing device or organ.
Loosely, data and information are used interchangeably, which is not correct, we will cover the difference in an upcoming section.
Data, information, knowledge, and wisdom are closely related concepts, but each has its own role in relation to the other, and each term has its own meaning, we will also touch on this part soon.
References:
https://harvard-iacs.github.io/2020-CS109A/lectures/lecture02/slides/Lecture02_Data.pdf
https://docs.microsoft.com/en-us/learn/modules/explore-core-data-concepts/2-identify-need-data-solutions
https://en.wikipedia.org/wiki/Data

DATUM, DATA AND DATASET
Mostly we talk about data but occasionally, you may hear terms like datum or dataset, lets's understand the difference. A datum is a single piece of information, which can be treated as an observation. Data is plural of datum, which we can say multiple observations. Dataset is a homogenous collection of data (each datum must have the same focus).
References:
https://harvard-iacs.github.io/2020-CS109A/lectures/lecture02/slides/Lecture02_Data.pdf

INFORMATION
When data is processed and put into context, it becomes information, which can be utilized by humans in a significant way i.e. making decisions, forecasting, etc
References:
https://en.wikipedia.org/wiki/Information

KNOWLEDGE AND WISDOM
When we put relevant information to work in a specific domain, it becomes knowledge. And when that knowledge is enhanced with first-hand experience, it becomes wisdom.
Let’s relate it to an example:
‘100’ number is data
‘100 miles’ is information
‘100 miles is quite a far distance is a knowledge
‘100 miles is very difficult to walk’ is wisdom.
References:
https://en.wikipedia.org/wiki/DIKW_pyramid
DIFFERENT ASPECTS OF DATA
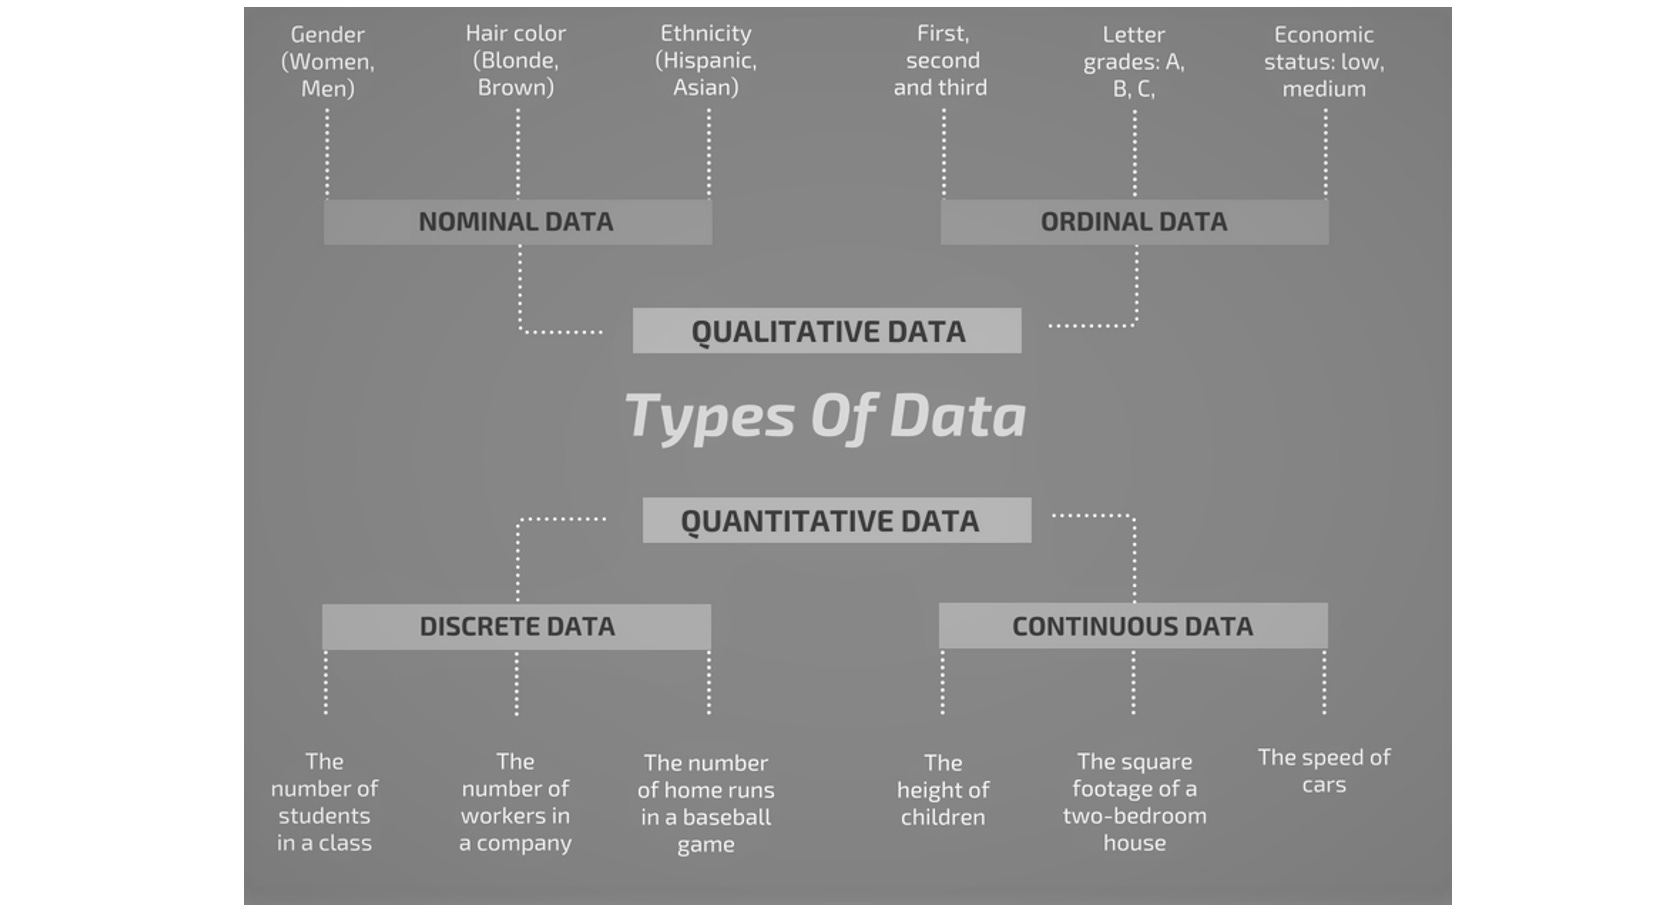
TYPES OF DATA
While working on these data, it is important to know the types of data to process them and get the right results. There are two types of data: Qualitative and Quantitative data.
Qualitative data can further be classified into nominal and ordinal, while Quantitative data can be classified into discrete and continuous.
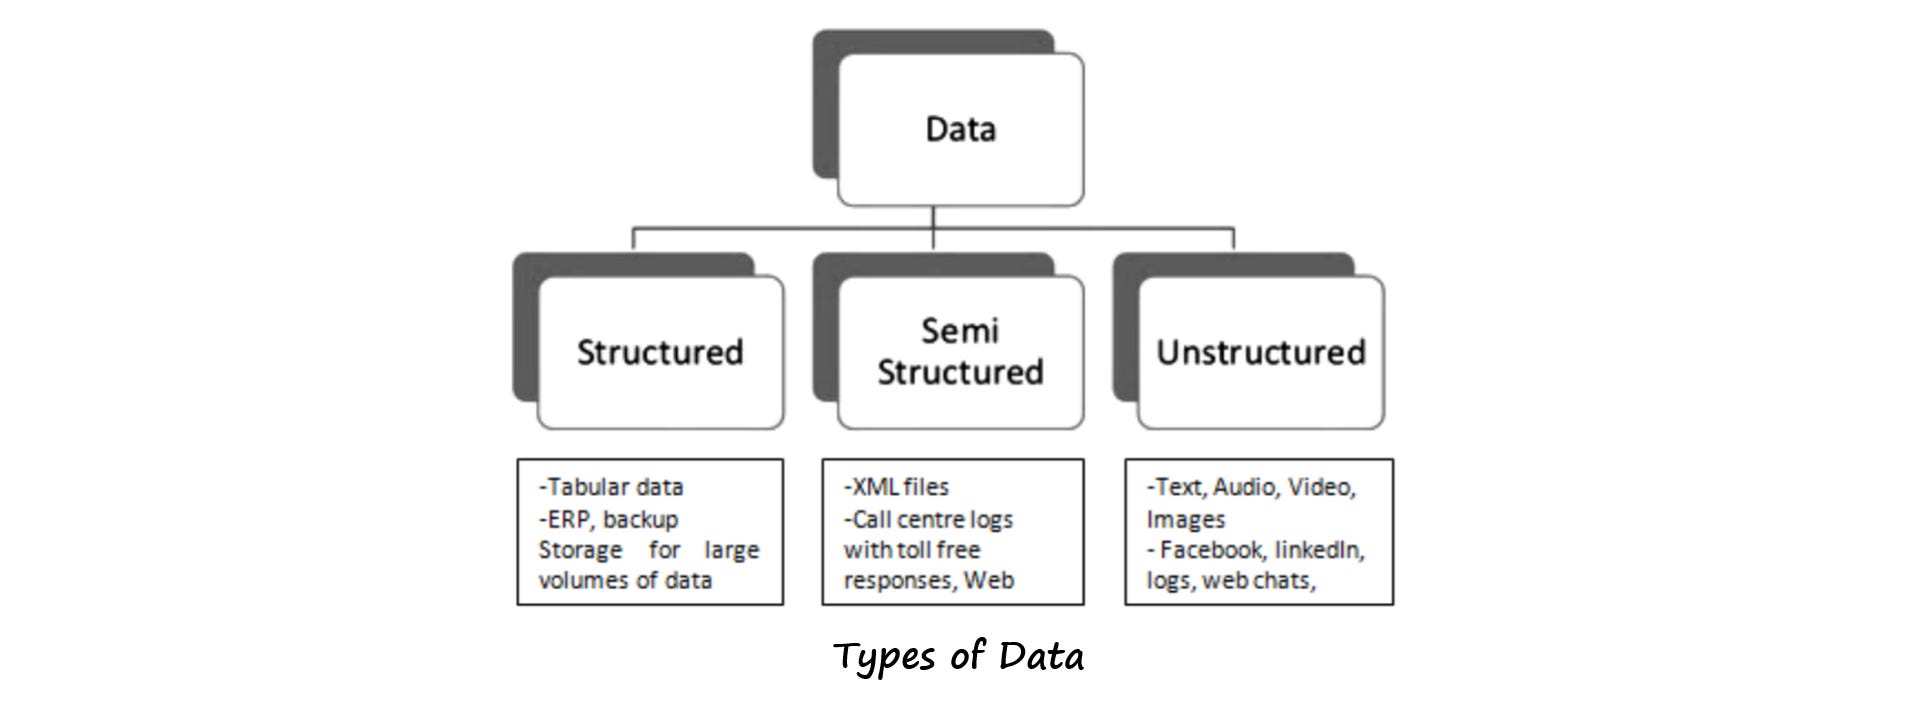
FORMATS OF DATA
We can classify data formats into three categories structured, semi-structured, and unstructured:
Structured data has a definite structure like a table with rows and columns.
Semi-structured data has some structure like JSON, key-value, or graph database.
Unstructured data has no specific structure like photos, audio, and video files.
References:
https://docs.microsoft.com/en-us/learn/modules/explore-core-data-concepts/2-identify-need-data-solutions
https://harvard-iacs.github.io/2020-CS109A/lectures/lecture02/slides/Lecture02_Data.pdf

SCOPE OF DATA
Data can be classified into two categories based on scope:
Population, which means we have access to all the data
Sample, which means only a portion is available or feasible
We don’t have access to all the data in most of the cases, in these cases, we collect the sample in a way that contains most of the information from the population so that we can estimate the patterns in population from that sample.
References:
https://harvard-iacs.github.io/2020-CS109A/lectures/lecture02/slides/Lecture02_Data.pdf
BIASES IN DATA
Bias in data means over or under-representation of a sub-population, which may not be intentional.
These are the types of biases that exist in data:
Omission: using arguments from only one side
Source selection: including more authoritative sources from one side
Story selection: sharing stories that agree with one side
Placement: unimportant stories get important placement in reputed media platforms
Labeling: labeled on one side or missing labels on other side
Spin: stories providing only one interpretation of an event
References:
https://harvard-iacs.github.io/2020-CS109A/lectures/lecture02/slides/Lecture02_Data.pdf
DATA USAGE
Data is used in the following fields:
Scientific Research: Factual data is both, an essential resource and a valuable output
Business Management: Data helps understand and improve processes
Finance: Whoever has the best and the fastest information gains the edge
Governance: Open data platform to help promote data-driven governance
References:
https://en.wikipedia.org/wiki/Data
DATA ANALYSIS
Data analysis is a process for obtaining raw data and converting it into information useful for decision-making by users.
Data is collected and analyzed to answer questions, test hypotheses, or disprove theories.
These are the steps of a typical data analysis process:
Data requirements: to understand what input would be required for analysis
Data collection: to collect those inputs from various sources
Data processing: to process or organize data for analysis
Data cleaning: to deal with incomplete, inaccurate, redundant elements
Exploratory data analysis: to explore data and understand the patterns
Data product: to convert data into actionable inputs
Communication: to convey the results of the analysis to users
References:
https://en.wikipedia.org/wiki/Data_analysis
Ankit Rathi is a Cloud Data Technologist, published author & well-known speaker. His interest lies primarily in building end-to-end data/AI applications/products following best practices of Data Engineering and Architecture.